What is the Airbnb value rating
Airbnb allows guests to rate their stay across six individual categories and one overall rating on a scale of one to five stars. The Airbnb value rating is one of those six individual ratings. Airbnb defines value as “did the guest feel that the listing provided good value for the price?”. This is one of the categories hosts have the hardest time scoring a five on. It’s also a category that has strong influence on the overall rating. Guests that give five stars on value are more likely to give five stars overall.
Introduction to the Analysis
For this analysis I’ve used data I acquired myself as well as data provided by Inside Airbnb. Inside Airbnb is an activist project with the objective to provide data that quantifies the impact of short-term rentals on housing and residential communities.
The data used here contains listings from across the United States. It should be noted that there are likely differences from market to market. Therefore, it’s best to consider these insights in general terms rather than specific. Although we’ll be specific for the sake of illustration.
As usual I won’t get too technical in this post. Rather, I’ll focus on the insights and talk about the approach more broadly. For those interested, the full code is on the github for this project.
I started by modeling value using every feature available in the data including other category ratings, amenities offered, etc. I found in doing this that category ratings overwhelmingly provided the predictive power. So instead I decided to take a three-prong approach. First, I modeled value as a function of all other category rating, then by non-amenity features and finally amenities.
Modeling Airbnb value using other category ratings
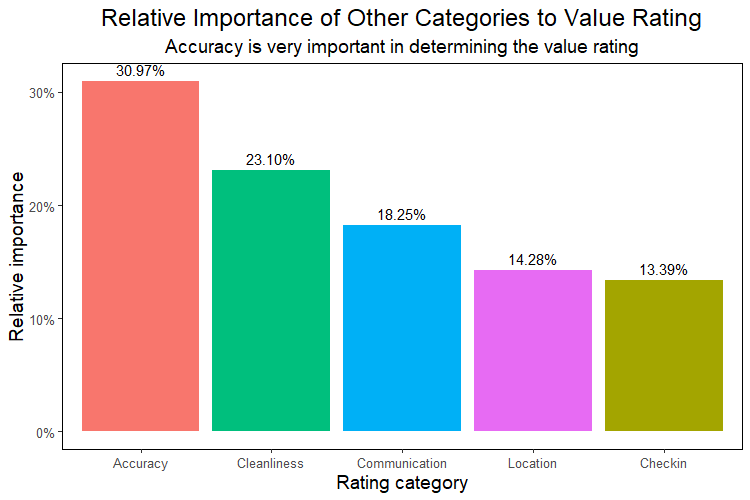
The first model we’ll explore is the value rating linearly regressed using all other category ratings. Doing so provided an R2 of 72%. In other words, how a guest scores a listing on the other 5 categories will explain 72% of the value score. We can then take an approach called relative importance to determine how much each category contributes to the prediction. Doing so shows accuracy is by far the biggest predictor of value. Accuracy is followed by cleanliness then communication with location and check-in last.
How do Airbnb guests define value
To understand these results, we need to first define value. The Harvard Business Review (HBR) defines value as “what a customer gets in exchange for the price it pays”. Considering this definition its clear why the accuracy score is such a strong predictor of the value score. When a guest books a listing, they are agreeing to pay a given price for some perceived value. How the stay measures up against those expectations will strongly influence the guest’s perception of value.
Likewise, cleanliness is a universal expectation in the hospitality industry, which is why it has such a strong influence on value. Interestingly, location has comparatively little impact on the value rating.
Modeling Airbnb value using listing features
Even though the other category ratings provided much of the predictive power when modeling the value score, it is still worthwhile to model the other features to generate additional insights. For the next two models, we’ll take an approach called logistic regression.
Logistic regression is used to estimate the probability of some binary outcome occurring. For our purpose, we will predict whether a listing has a value score of at least 4.8 or not. This will give us a sense of if the feature is contributing value to a listing.
After some trial and error I identified the following non-amenity features of interest to use in the model:
- Super host status
- Host total listing count: number of listings managed by host
- Room type: private versus shared
- Bedrooms per Accommodates: expressed as ratio of the number of bedrooms per number of guests a listing can accommodate. For example, a listing that has 2 bedrooms and can accommodate 4 people would have a ratio of 2 / 4 = 0.5
- Security deposit
- Cleaning fee
- Extra people fee
- Instant bookable: the listing is instant bookable or not
- Cancellation policy
- Listings per sq km: A measure of listing density. It is calculated as number of listings in the neighborhood divided by the area (in square kilometers) of that neighborhood
- Property type: House, apartment/condo or other
- Pets allowed
Interpreting the model
In the model, numeric features (e.g. cleaning fee, security deposit) were standardized. Categorical features (super host status, cancellation policy) were one hot encoded. To help with the interpretability of the output, the data set excluded the top 5% of all numeric features. For example, listings in the top 5% of all cleaning fees were excluded. In total there were 54k listings in the data set.
There is a lot to be said about judging the effectiveness of logistic regression models. However, since we’re only interested in interpreting the inputs and not using it in the real world, a simple accuracy will suffice. The accuracy, measured as correct predictions from a test set, was 64%.
Finally, we’ll pass the coefficients through an exponential function (e to the power of x) to present the features as odd ratio. Because we standardized the numeric variable, they can now be interpreted as how much a one standard deviation will increase (or decrease) the probability of a listing having a value score of 4.8 or higher. Similarly, for the categorical features the odds ratio represents how much the presence of that feature in a listing will increase (or decrease) the probability of the listing having a value score of 4.8 or higher.
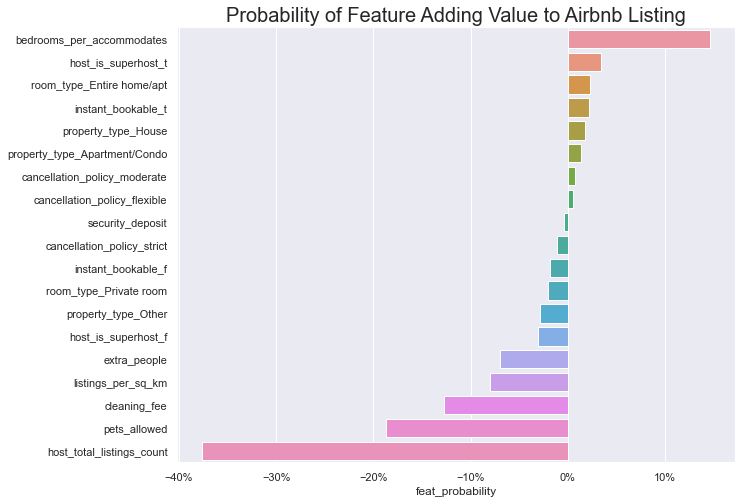
The odds ratios of features modeled are as follows and offer some interesting insight into the guest perception of value.
More bedrooms increases value
The top feature identified with this model contributing value to a listing is the bedrooms per accommodates ratio. In general terms as this ratio increases, the value rating is likely to be higher. It can also be stated more specifically as every 0.23 increase in the bedrooms per accommodates ratio means a listing is 15% more likely to receive a value rating of 4.8 or higher.
In an unrealistic example, let’s say a listing that accommodates 8 people went from having 4 bedrooms to 6 bedrooms. The bedrooms to accommodates ratio would change from 4 / 8 = 0.5 to 6 /8 = 0.75. The model predicts that that listing is now 15% more likely to receive a value rating of at least 4.8.
Superhost status and room type don’t predict the value rating
A lot of the other features explored here barely move the needle in terms of predictability. Superhost status reveals what we would expect to be true, hosts with the status are more likely to score higher on value than hosts without the status. But the degree to which Superhost status predicts value is quite low. Having the status only increases probability of listing having a 4.8 or higher on value rating by 3%.
Similarly for room type an entire home listing has a higher probability of delivering value versus a private room but not by a significant amount. The takeaway here is that it’s possible for a host without Superhost status to deliver just as much value as a Superhost and for a private room to deliver as much value as an entire home. As we uncovered in the first model, it comes back to expectations. Setting appropriate expectations will help to score higher on value.
Cleaning fees and extra guest fees hurt value
Further on down the graph are some more interesting takeaways – features that are likely to hurt value. To parse out why these features are negatively affecting value, we will again refer to the HBR definition of value. It states that value is the net benefit that a customer receives in exchange for a price. The net benefit includes “any costs a customer incurs in obtaining the desired benefits, except for purchase price”.
From a guest perspective, the purchase price is the nightly rate for the accommodation. The cleaning and extra guest fees are additional costs the guest incurs thus they have a negative impact on the net benefit.
Like the bedrooms per accommodates ratio, we can use the odds ratio and standard deviations of these features to be specific. The model states that for every $52 increase in the cleaning fee a listing is 13% less likely to score a 4.8 or higher on value. For every $11 increase in the extra guest fee a listing is 7% less likely to score a 4.8 of higher.
More competition decreases Airbnb listing value
To understand why listings per sq km has a negative impact on value, we can refer to the general equation the HBR provides:
(Values – Prices) > (Valuea – Pricea)
Values and Prices are the value and price of the supplier’s market offering, and Valuea and Pricea are the value and price of the next best alternative. The difference between value and price equals the customer’s incentive to purchase. Simply put, the equation conveys that the customer’s incentive to purchase a supplier’s offering must exceed its incentive to pursue the next best alternative.
James C. Anderson and James A. Narus. “Business Marketing: Understand What Customers Value”. Harvard Business Review.
This definition tells us that the guest’s perception of value happens in context of alternatives. For a guest, they are measuring the decision to book a listing against all alternatives. As the density (listings per sq km) increases, so does the number of alternatives the guest is considering.
We can also assume that these high-density neighborhoods also contain hotels and other lodging options which puts even more competitive pressure on a given listing. To put this in terms of the model, for every increase of 57 listings per sq km a listing is 8% less likely to score 4.8 of higher on value.
Allowing pets decreases Airbnb listing value
The output of this model also sheds light on whether hosts should allow pets or not. The model tells us allowing pets results in a 19% decline in the probability the listing will score 4.8 or higher on value. To understand why this is, consider only guests who want to bring pets will perceive value in this features. All other guests that don’t want to bring pets will perceive no value in this feature.
In a vacuum, this wouldn’t have an impact on value. However, we’ve seen elsewhere that allowing pets can impact cleanliness due to pet hair, etc. The first model in this post showed how important cleanliness is to value. It follows then that a feature that compromises cleanliness will have a negative effect on value.
Management Entities deliver less value than individual hosts
Finally, the feature in this model that has the greatest negative impact on the value is the host total listing count – i.e. the number of listings under management. For every 13 additional listings under management by the same host a given listing is 37% less likely to score 4.8 or higher on value.
There could be many reasons for this. It could be as simple as the more listings a host has under management, the more thinly spread they are and the less time they are able to dedicate to individual listings. As the number of listings goes up its not hard to imagine attention to detail declines. On the other hand, its not uncommon that multiple listings are managed by a commercial entity and not an individual host.
So, while the lack or personal touch may be contributing to a decline in the value score, the way these entities operate offers another explanation. At a certain scale it is more than likely that a management entity is utilizing pricing software or channel managers. We can assume that the listings under management are priced more dynamically in response to market conditions and to maximize profit. Therefore, in the tradeoff of value versus price, management entities are better equipped to optimize the price side of the equation. This could be impacting the value score for these listings.
Modeling Airbnb value rating using amenities
The final model used only amenities as the predictors in the same logistic regression approach used for the last model. After constraining the data set to listings with at least 5 reviews, we were left with 150k listings. Amenities used to predict value were limited to those that appeared in at least 1,000 of those listings. Extremely rare or individualized amenities were excluded from the model.
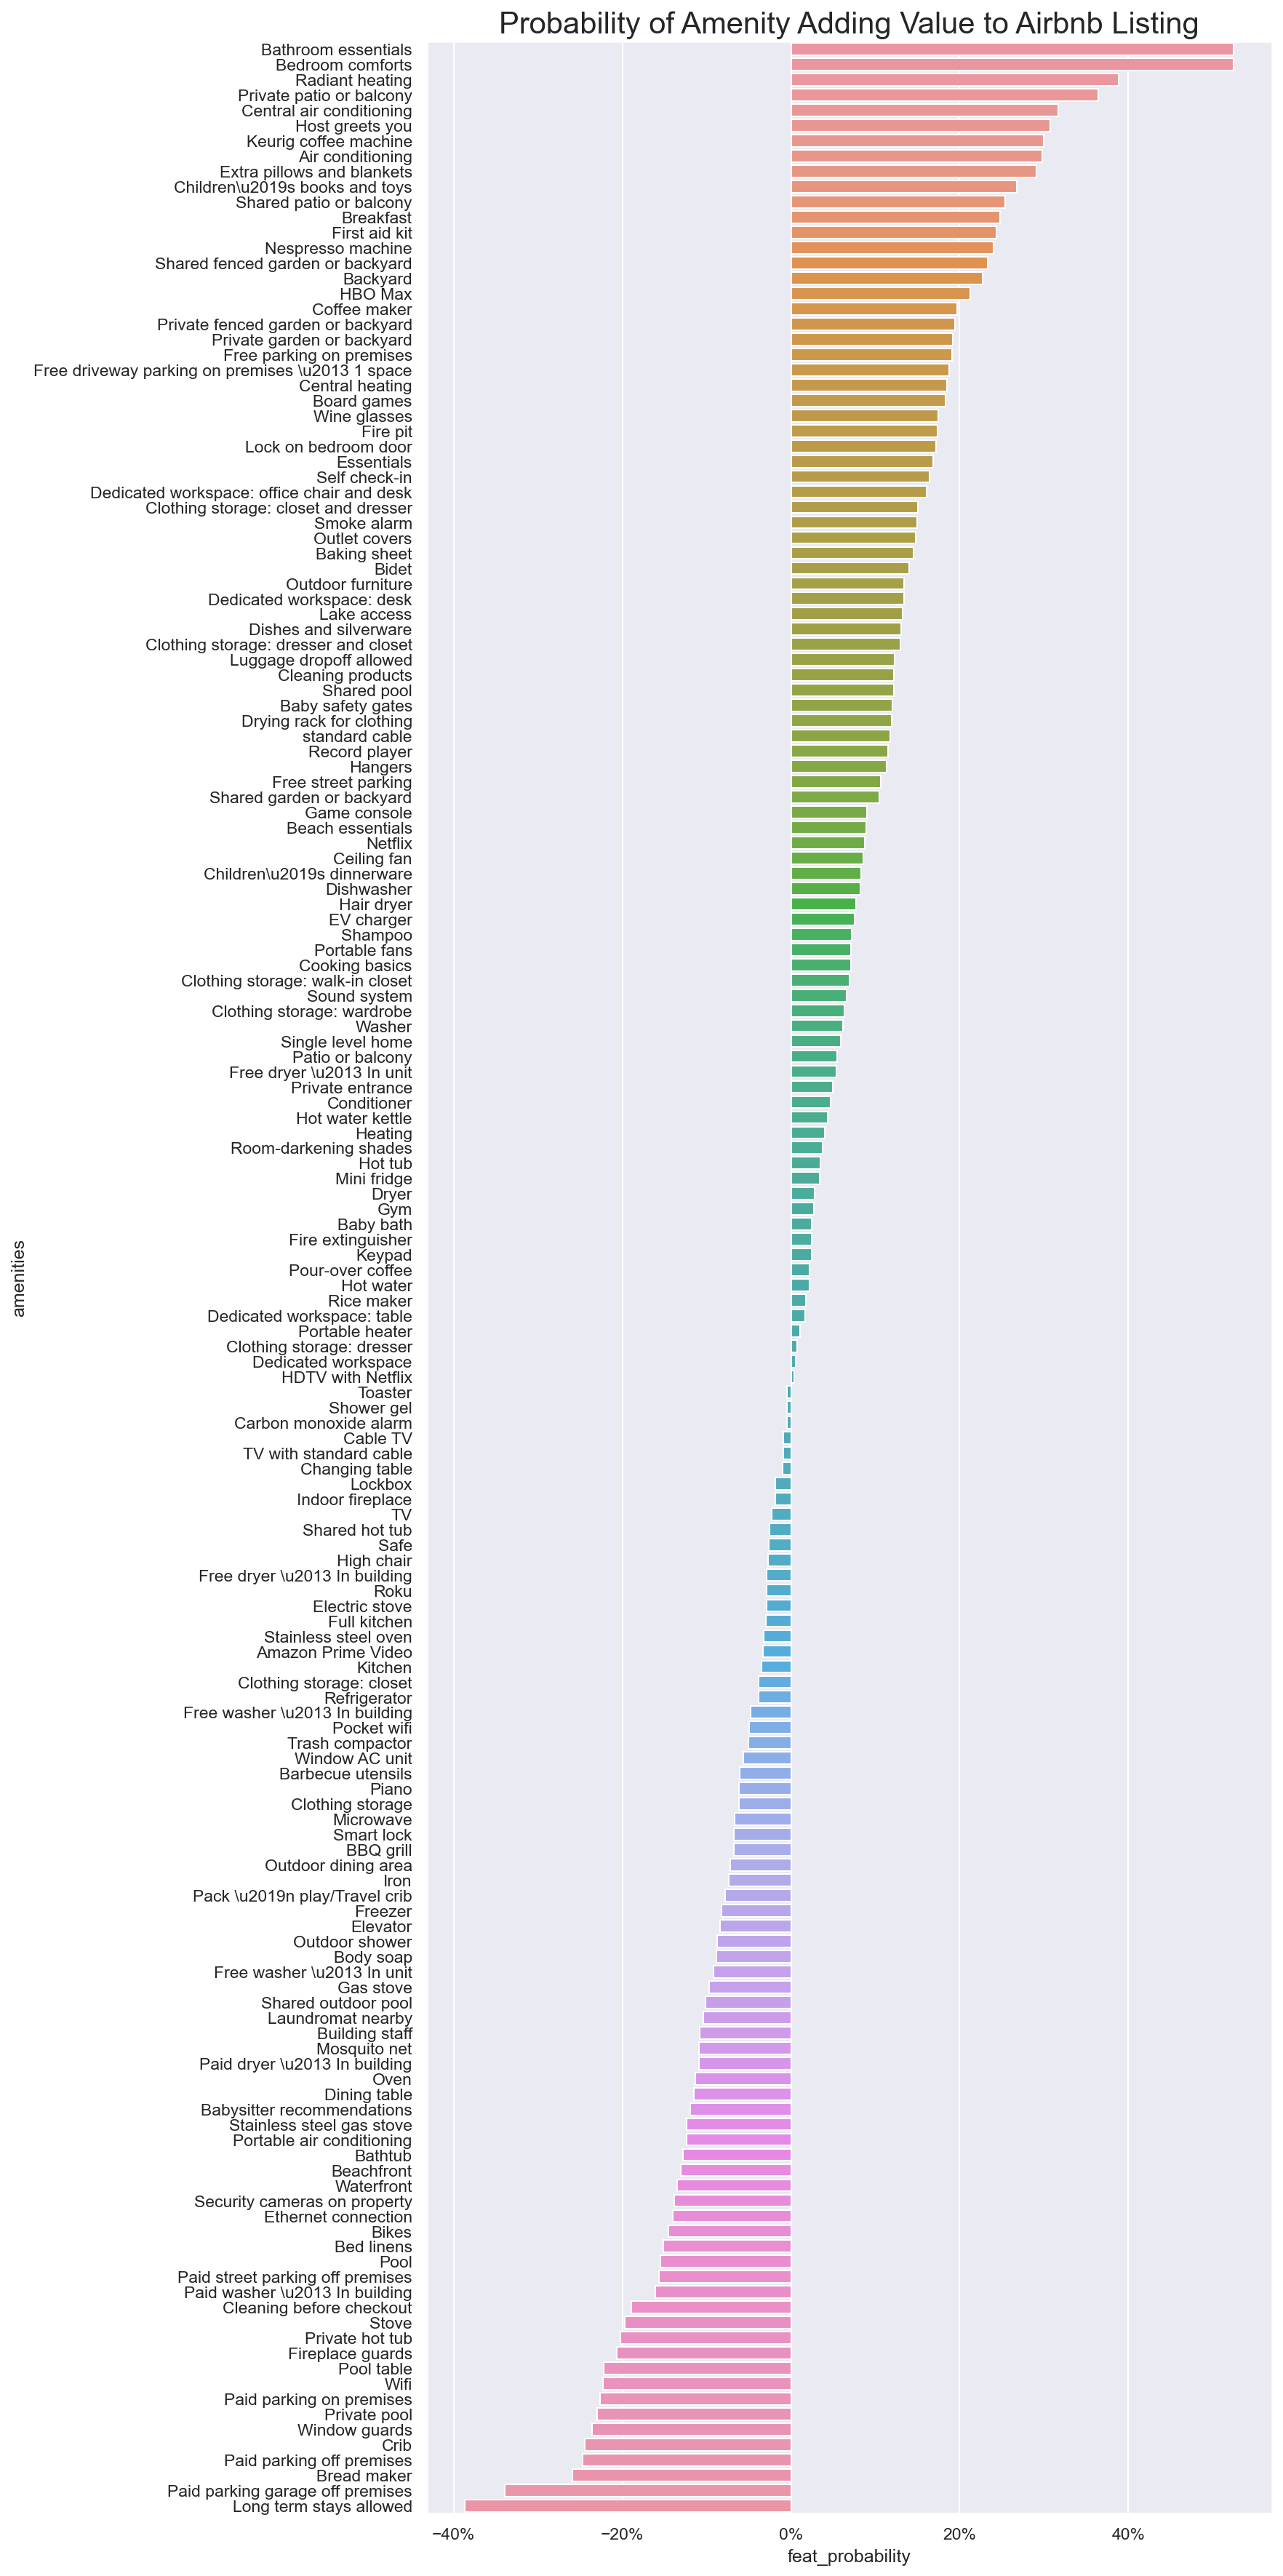
The resulting model delivered an accuracy of 61%. Like the previous model, the coefficients were passed through an exponential function so they could be interpreted more clearly. The presence of the following amenities will increase (or decrease) the probability that listing scores at least 4.8 on value. Here are the results of the model.
Amenities have an impact on the Airbnb value rating
There are too many amenities to talk about each one individually. There were 162 included in the model in total. For some amenities, there are likely alternative explanations for their influence on the model.
For example bedroom comforts (which includes bed sheets, pillows, and hangers) is the amenity that predicts the second highest probability of scoring high on value – but these are pretty universally expected. Likewise, wi-fi is included in almost every listing and is expected by most guests so its unlikely to negatively impact value.
As mentioned at the beginning of this post, it’s best to consider these results directional rather than take them at face value. Having said that, as with the last model we’ll explore and speculate on why some of these amenities appear to have an impact on value.
Outdoor spaces create value
Having an outdoor space available to guests appears to have a positive impact on value regardless of whether it is shared or private. A private patio or balcony provided the greatest lift to the probability of scoring at least 4.8 on value at 36%. However, all other types of spaces including gardens and backyards have a positive effect on value as well.
Offering little extras can improve the value rating
Providing the little things can increase value for guests. Many of amenities modeled here aren’t things guests search for when looking for a place. But we can see they have a positive impact on perceived value. A coffee maker will improve the probability of a listing score 4.8 or higher by 19%, including breakfast has a 25% probability, including board games has an 18% probability and so on.
Prime locations can suffer from low value ratings
Location based features including beachfront and waterfront were negative contributors to value. This is consistent with the observation from the first model that location doesn’t factor into value. What’s likely happening here is premium locations are being priced as such, but guests are not perceiving the value added leading to lower value scores. This must be frustrating for hosts who have prime locations but struggle with the value rating.
Long-term rentals don’t deliver value on a STR platform
Allowing long-term stays had the biggest negative impact on value modeled. Doing so results in a 38% decrease in the probability a listing will score 4.8 or higher in value. What is likely happening here is not the amenity driving down value, but rather the type of host. We know there is a small segment of hosts that use the platform to find long-term guests. The way these hosts are using the platform is inconsistent with the short-term rental value proposition that is core to the platform. It stands to reason then that the hosts themselves are not delivering the value expected from short term rentals.
Paid parking decreases the value rating
Just like the cleaning fee and extra guest fee, when a guest must pay for parking, it will have a negative impact on the net benefit of the value equation. Having a paid parking garage off premises results in a 34% decrease in probability a listing will score 4.8 or higher on value. Similarly all other paid options have a negative impact on value while free parking has a positive impact.
Pools can result in lower Airbnb value ratings
Pools are presumably desirable amenities. However, having a pool (or private pool) decreases the probability that a listing will score 4.8 or higher by 16% (or 23%). While it maybe be desirable, a pool can also be hard to maintain or consistently have available for all guests. If this amenity isn’t as the guest expects, it will impact accuracy which we established has a big effect on value.
Key Takeaways
- Guests want to get what they paid for. Meeting guest expectations is the best way to receive a high Airbnb value rating from guests.
- It’s best to under promise and overdeliver. Adding little touches can really increase the perception of value.
- Accuracy is especially important to guests. Be sure to list all amenities and features of the listing accurately.
- Be aware that additional fees can challenge the guest’s perception of value.