Introduction to the Analysis
For this analysis we’ll continue to build insights about the cleanliness rating on Airbnb. In this previous analysis, we uncovered that the cleanliness rating is not correlated with the cleaning fee. In other words, on average, a higher cleaning fee does not necessarily lead to a cleaner listing. We also found that there was a relationship between the cleaning fee and the value rating. The higher the cleaning fee, the lower the value rating was on average. Finally, we speculated that some hosts may be using the cleaning fee as a variable pricing mechanism.
For this analysis, first we’ll look at whether the size and type of listing has an impact on the cleanliness rating. A bigger space takes more time to clean, but does this mean that bigger spaces tend to receive lower cleanliness ratings? Next, we’ll look at whether the number of listings a host (or company) manages affects the cleanliness rating. Finally, we’ll look at the effect of minimum nights. For the analysis, we’ll use a dataset of 250k listings from the US from April 2020. Data was sourced from Inside Airbnb, an activist project with the objective to provide data that quantifies the impact of short-term rentals on housing and residential communities
For this analysis, it’s important to acknowledge the overlap in factors explored. No one factor will fully explain the cleanliness rating on it’s own. In fact, how a host themselves manage their listing has more to do with cleanliness than anything explored here. Having said that, let’s look at what the data says about the cleanliness rating.
Size and type of listing vs cleanliness rating
First let’s look at how the size of the space affects the cleanliness rating. To do this, we’ll look at the number of bedrooms as well as the number of guests it can accommodate. Both will be similar but not identical indicators of the listing’s size.
Below is a bubble chart which can be used to summarize data. In this chart, listings were grouped by number of bedrooms. The number of bedrooms appears on the x-axis. The y-axis is the average cleanliness rating of those listings. The size of the bubble shows the number of listings in each data point. The dotted line shows the approximate relationship between number of bedrooms and the cleanliness rating.
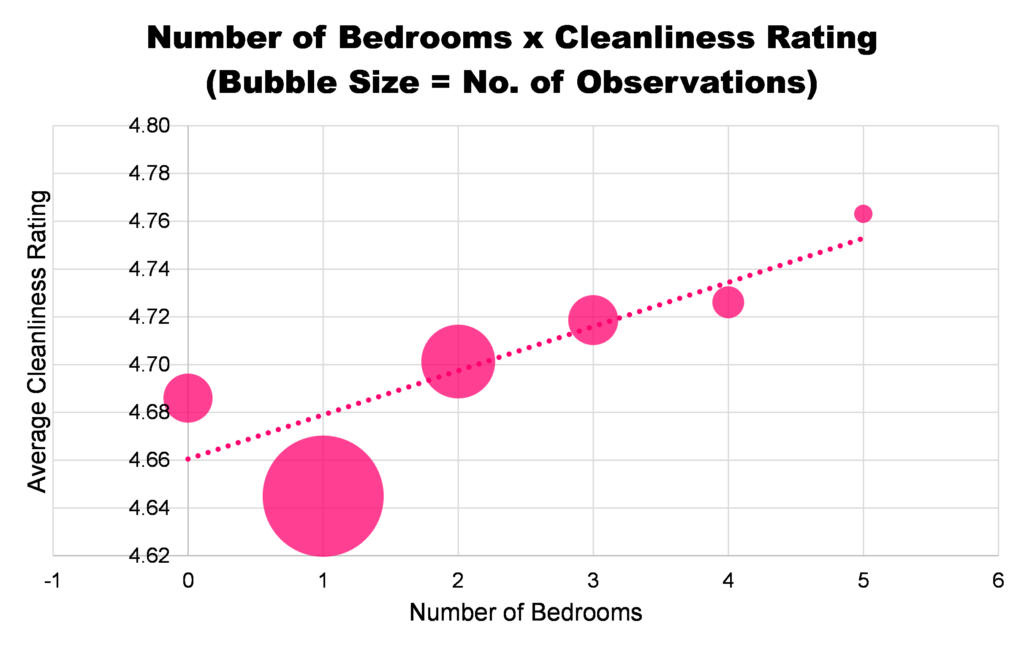
Here we can see a positive correlation between the cleanliness rating and number of bedrooms. In other words as the number of bedrooms rises so does the cleanliness rating. Next let’s do the same thing but with guests accommodated instead of bedrooms.
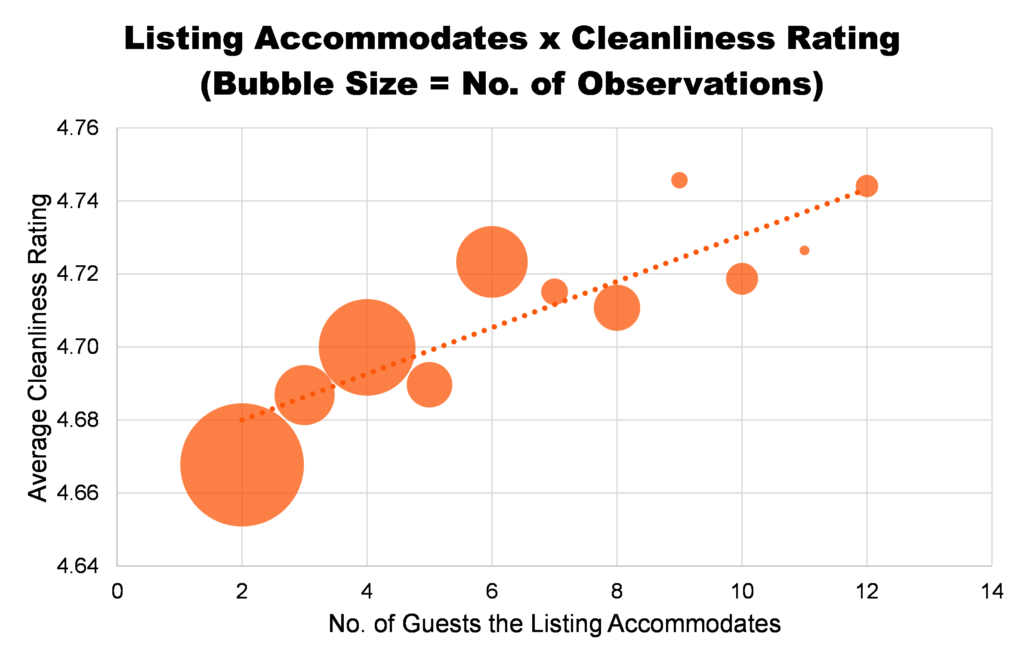
Here again we can see a positive correlation. In statistics it’s important to remember that correlation doesn’t equal causation. In this instance, we shouldn’t conclude that the bigger the space, the higher cleanliness rating. Let’s instead reason what could be happening here.
Why does the cleanliness rating rise with listing size
What this correlation may actually be uncovering is how standards and expectations change with group size. As the group size grows, the options on Airbnb become more limited. There are many listings that accommodate two guests and few that accommodate 10+ guests.
The lack of choice for larger groups may in turn lower their expectations. Furthermore, as group size grows intimacy decreases. Perhaps, a couple sharing an Airbnb are more likely to find problems with the cleanliness rather than a larger group more intent on socializing. Whatever the reason, it’s unlikely a direct function of the size of the listing itself as the correlation shows.
Type of listing vs cleanliness rating
Next we’ll compare the type of listing and the average cleanliness rating. The following chart shows the average cleanliness rating of entire homes, private rooms and share rooms.
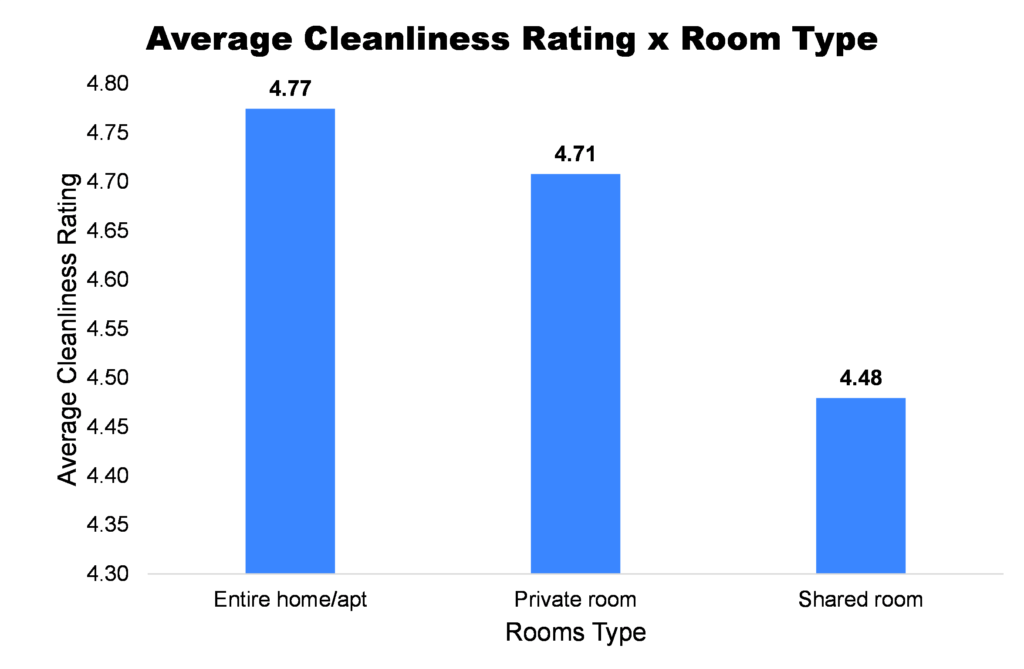
Here we can see that entire homes have the highest cleanliness rating on average, followed by private rooms and finally shared rooms. The relationship here is clear, the more the space is co-habited the lower the cleanliness rating. This points to guests not having calibrated expectations. It can’t be expected that spaces that are cohabited will be as clean as entire homes which can be turned over, thoroughly cleaned and left untouched between guests. Nevertheless, cohabited spaces tend to have lower cleanliness ratings on average.
Number of listings managed versus the cleanliness rating
Next we’ll look at the number of listings managed and the average cleanliness rating. Once again we’ll use a bubble chart as was done above. This time however, notice the break in the x-axis. There are many hosts managing less than 10 properties (with most managing just one). However, there are also management companies with 10+ properties. To fit all these observations on the same chart, observations of 10+ were grouped by range. Each observation represents a range of 10 (e.g. 10 to 20, 20 to 30 and so on).
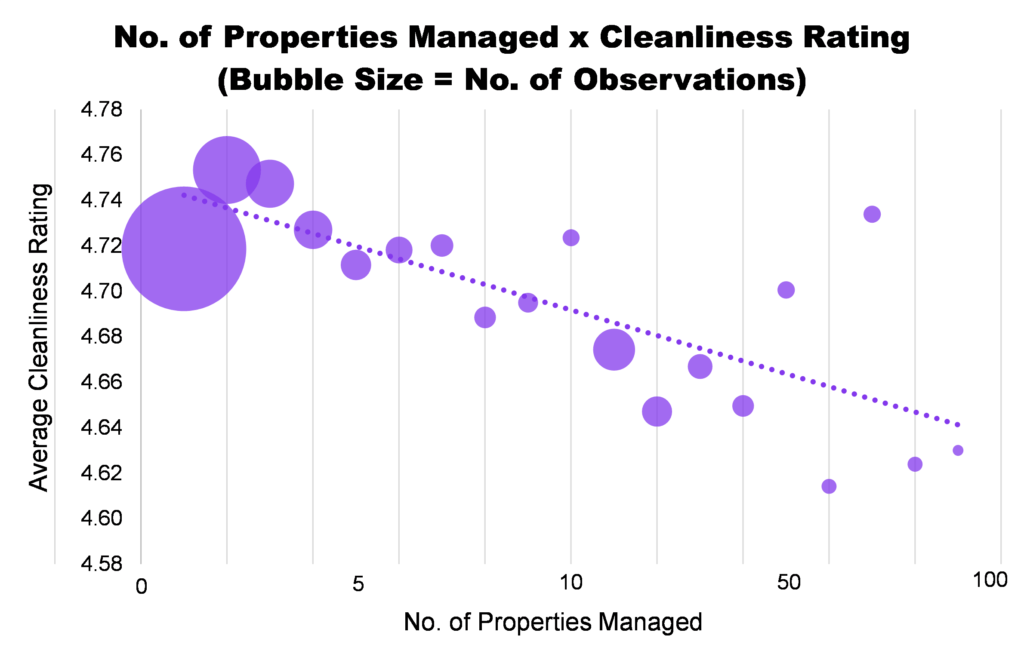
Here we can see that as the number of properties manages increases, the average cleanliness rating declines. Remember this is aggregated data. Not every host with one property has a cleaner space than a host (or management company) with multiple properties. It does however point to a trend. This shows the importance of doing research when working with a third party, whether it be a management company or a cleaning service.
Minimum nights vs cleanliness rating
Finally we’ll look at the relationship between the cleanliness rating and minimum nights. Below shows how the cleanliness rating compares among listings with minimum nights under 30 and at least 30. 30 nights is a common cut-off for short and long term stays.
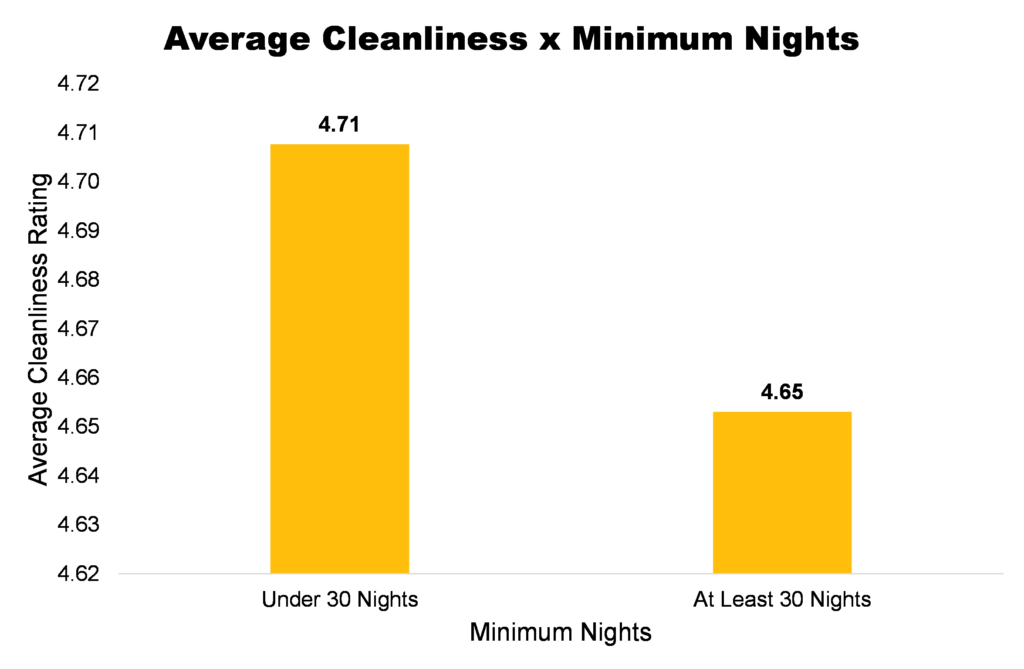
Here we can see listings offering long-term stays tend to have a lower cleanliness rating than short-term listings. One simple explanation for this is simply that listings with lower minimum nights are cleaned more often. By cleaning a space more often it’s easier to maintain a high level of cleanliness. On the other hand, listings with longer minimum nights are cleaned less often and thus require a deeper clean. The data suggests that this is not as effective as maintaining cleanliness as cleaning more frequently.
Key Takeaways
- It’s possible guest expectations change with the listing size. In turn, this could lead to better cleanliness rating for bigger spaces.
- Cohabited spaces (private and shared rooms) generally have lower cleanliness ratings than entire homes
- On average, as the number of properties managed grows, the cleanliness rating declines
- Listings offering long-term stays have a lower cleanliness rating on average than those with a lower minimum nights requirement