
Airbnb pricing for hosts
How to price an Airbnb listing is one of the most important decisions a host must make. The nightly rate they set will have an influence on guest reviews, occupancy and ultimately the profitability of their listing.
There is an entire industry of software as a service (SaaS) built around helping hosts answer the very question of how to price their Airbnb listing. These Airbnb pricing tools use tremendous amounts of data and more complex modeling than what I will share in this analysis to do so.
I’m also far from the first person to model price as a function of listing features as a data science exercise. There are many other examples on Medium and towards data science. My intent is that this analysis will differ from what is already out there by focusing more on the insights and less on the technical approach. In doing so, I will show how Airbnb listings are priced and in a more general sense, how SaaS companies come up with their price predictions.
Introduction to the analysis
In this analysis I’ll use a regression model to predict price as a function of Airbnb features. Recognizing that demand and price dynamics are unique to each market, I decided to look at eight different cities as case studies to draw generalized conclusions about the factors driving price.
I sourced the data for this project from two places. Airbnb listing data for September 2022 came from Inside Airbnb, an activist project with the objective to provide data that quantifies the impact of short-term rentals on housing and residential communities. I also brought in data from Walk Score, a company whose mission is to promote walkable neighborhoods.
As mentioned, I won’t get too into the weeds on the technical details of the analysis. As always, the full code used in this write-up can be found on the github for this project. However, it’s important to talk briefly about the chosen model. In a typical linear regression, each feature in the model will have a coefficient. The size of that coefficient will dictate how much that feature influences the target variable.
For our purposes, the target variable is price. We want to predict price as a function of listing features and the features I want to model include amenities. Of course, with all the options and customization now possible, thousands of amenities would end up in the model.
To address this, I first cut off amenities that didn’t appear in at least 100 listings in each city. I then chose to use a lasso regression for the model which applies a penalty to the coefficient through a process called regularization. Because this penalty can be zero, a lasso regression helps to reduce the number of features in a model. This will be useful with so many amenities to deal with.
Case studies chosen for modeling
The eight cities chosen were Chicago, Denver, New Orleans, New York, San Diego, Toronto, and Washington D.C. I included all listings from September 2022 with at least three reviews and nightly rate less than $1000. The number of listings by city and average price were as follows:
The features that were used to predict the price of a listing in these cities were as follows:
- Room type
- Number of guests accommodated
- Bedrooms
- Beds
- Minimum nights
- Maximum nights
- Is the listing instant bookable
- Is the host a Superhost
- Amenities
- Ratings (including overall, cleanliness, accuracy, communication, check-in, value, and location)
- Walk Score (which measures walkability on a scale from 0 – 100 based on walking routes to destinations such as grocery stores, schools, parks, restaurants, and retail)
- Listings per square kilometer (measured per neighborhood a listing resides in)
Airbnb price model accuracy
In regression, R2 is a measure that describes how much of the target variable is described by the predictors. In our case, how much of the Airbnb price can be described by the listing features. Running each of the case study cities through a lasso regression with the above features resulted in R2 values as follows:
With R2 values ranging from 0.44 to 0.64 these would not be strong results if we wanted to generate real world price predictions for the case study cities. However, since we only intend to examine the models and discuss the derived insights, these scores indicate the models are good enough for that purpose.
I’m also comfortable using these models for the following reasons. Firstly, these R2 values are in the ballpark of what I’ve seen in other write-ups for similar models. Secondly, we don’t need to be concerned with “over-fitting”. When over-fitting occurs, a model becomes unusable. In this analysis that would prevent us from gathering meaningful insights from the models. Finally, for reasons that I’ll discuss further below in more detail, I would be suspicious of any model that purports to predict Airbnb with a high degree of accuracy primarily using Airbnb features.
Airbnb pricing case study results
To summarize the results of the case studies more concisely, I’ll take a few steps to combine the models into something more digestible. When deriving insights from a model, we are typically interested in the coefficients. The coefficients tell us how much the response variable (price) moves with each standard deviation of the explanatory variable (listing features). Since I want to combine the coefficients from each case study, I’ll need to normalize them.
This can be done by dividing the coefficient by the average price of the city. We’ll call the resulting metric the “Price Influence Index”. In layman’s terms this metric describes how much a feature influences listing price relative to other features.
Next, I’ll remove features that don’t appear in at least four of the cities. Finally, I’ll take the average Price Influence Index of those features.
It’s important to note here that while I accounted for differences in the markets for each city by modeling them separately, this normalization allows me to combine them. However, in doing so I’m making a broad assumption that there is homogenous demand for the features modeled across the North American market. For example, in general the demand for an entire home versus a shared room is relatively similar regardless of the city.
The output of these steps can be summarized in the graph below.
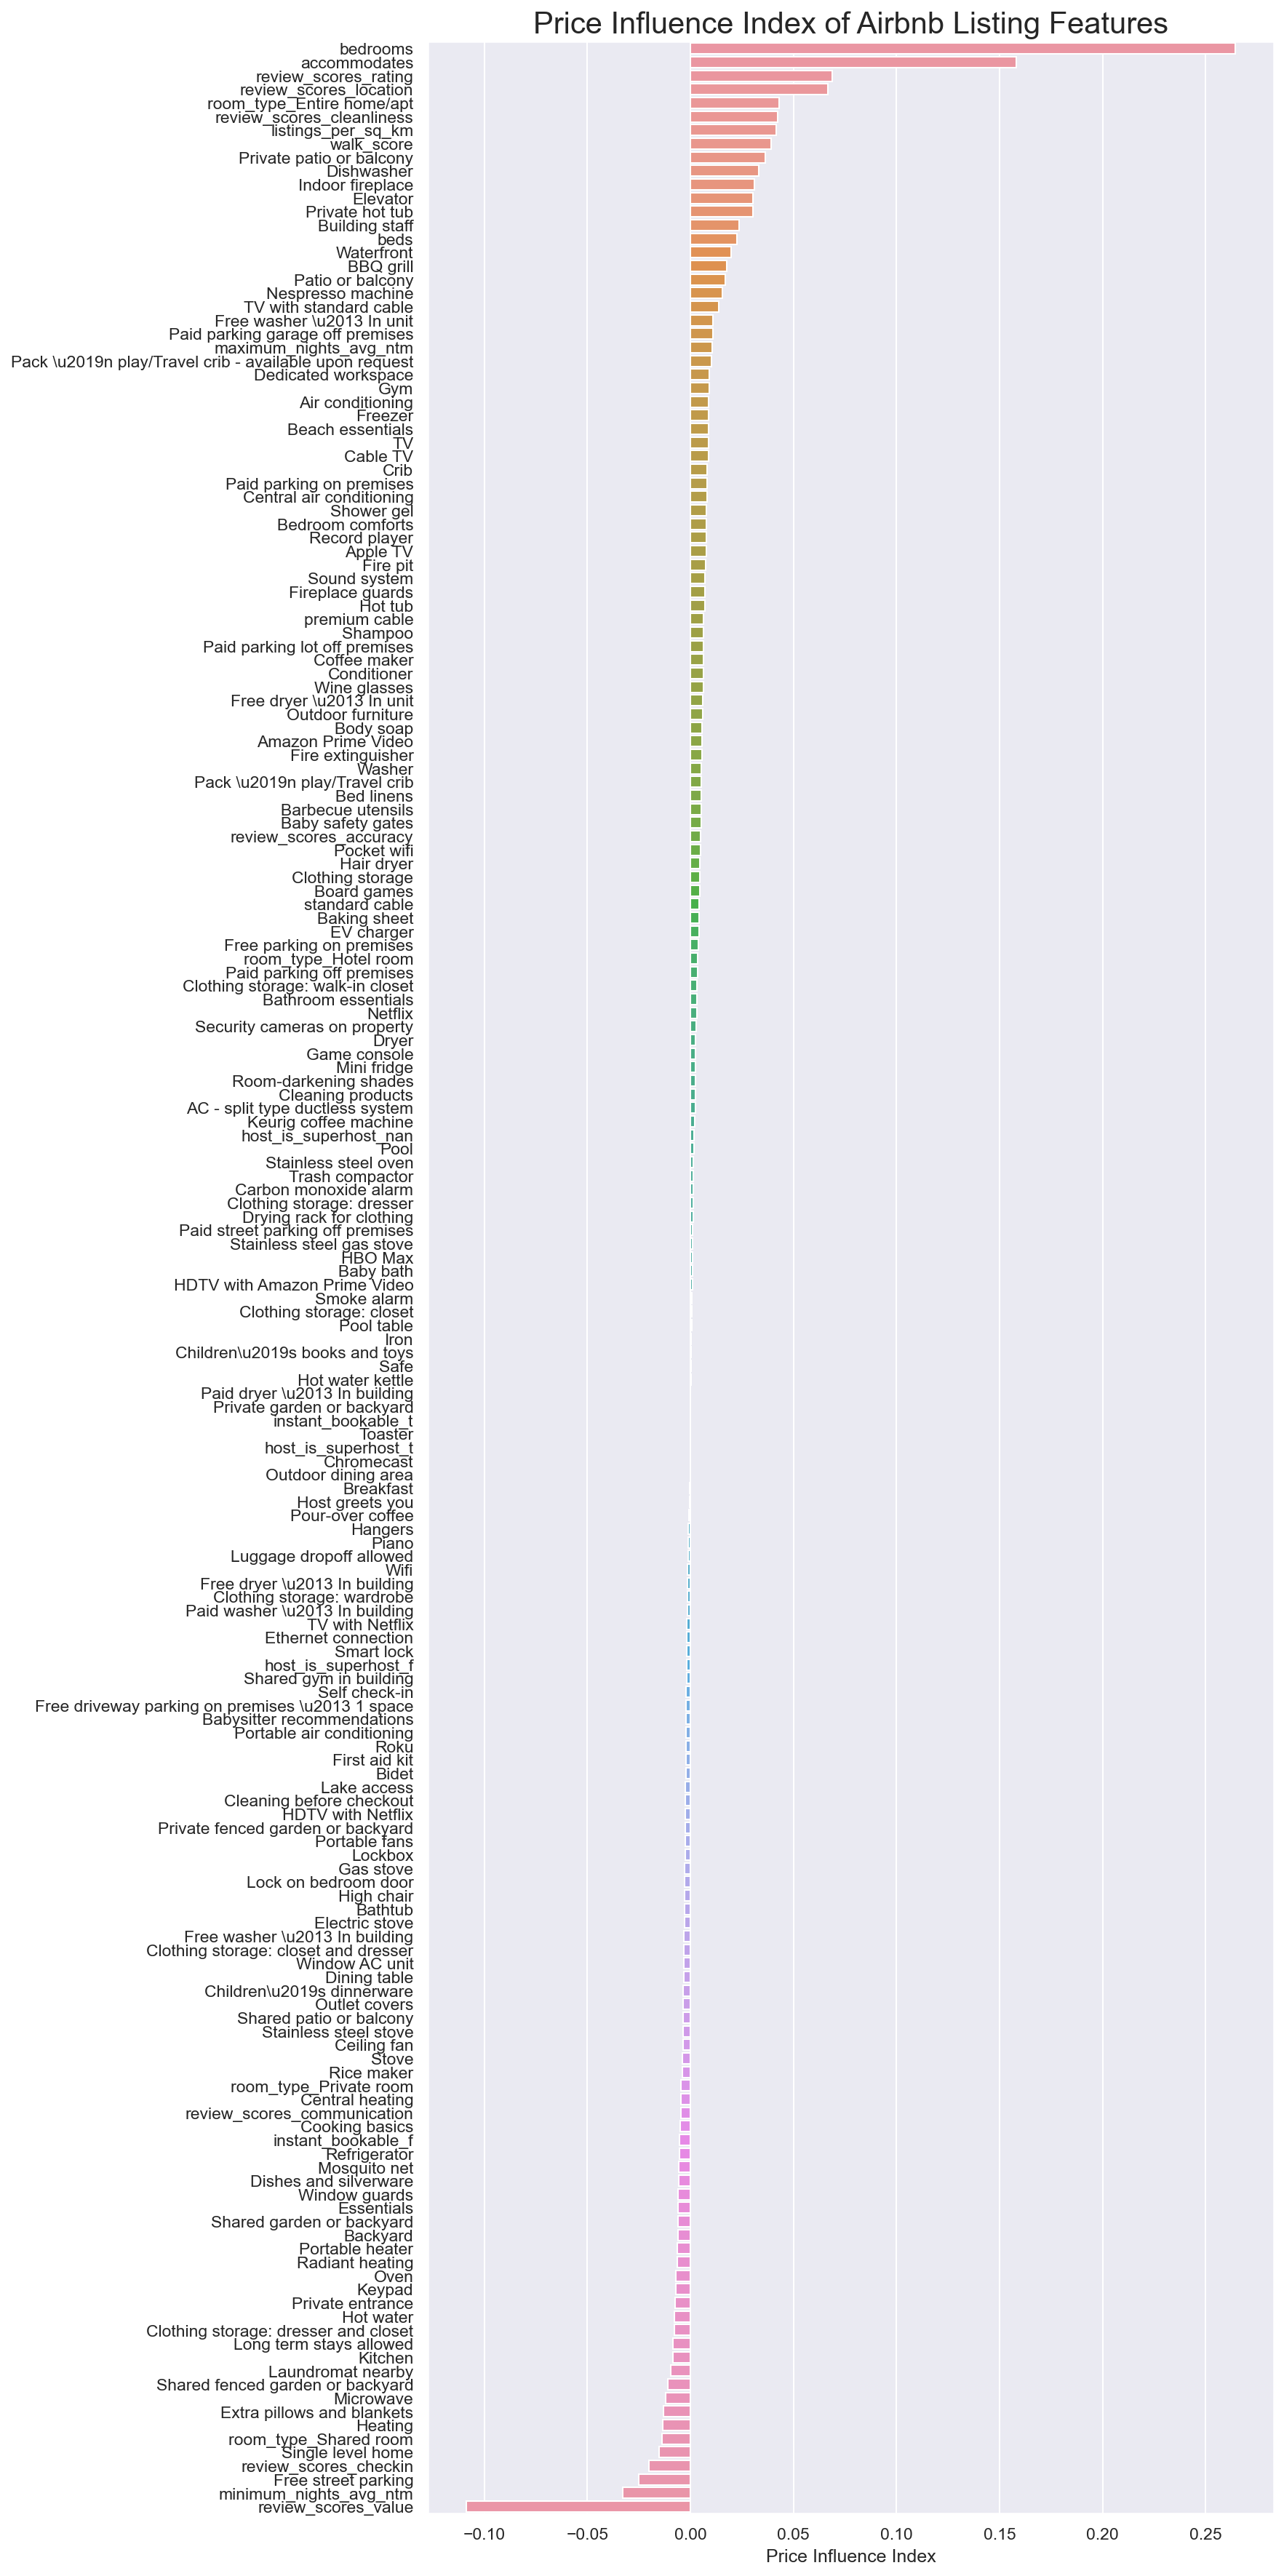
Factors influencing Airbnb price
The analysis uncovered some factors that had an influence on Airbnb price and many more that did not. Let’s discuss these factors in more detail.
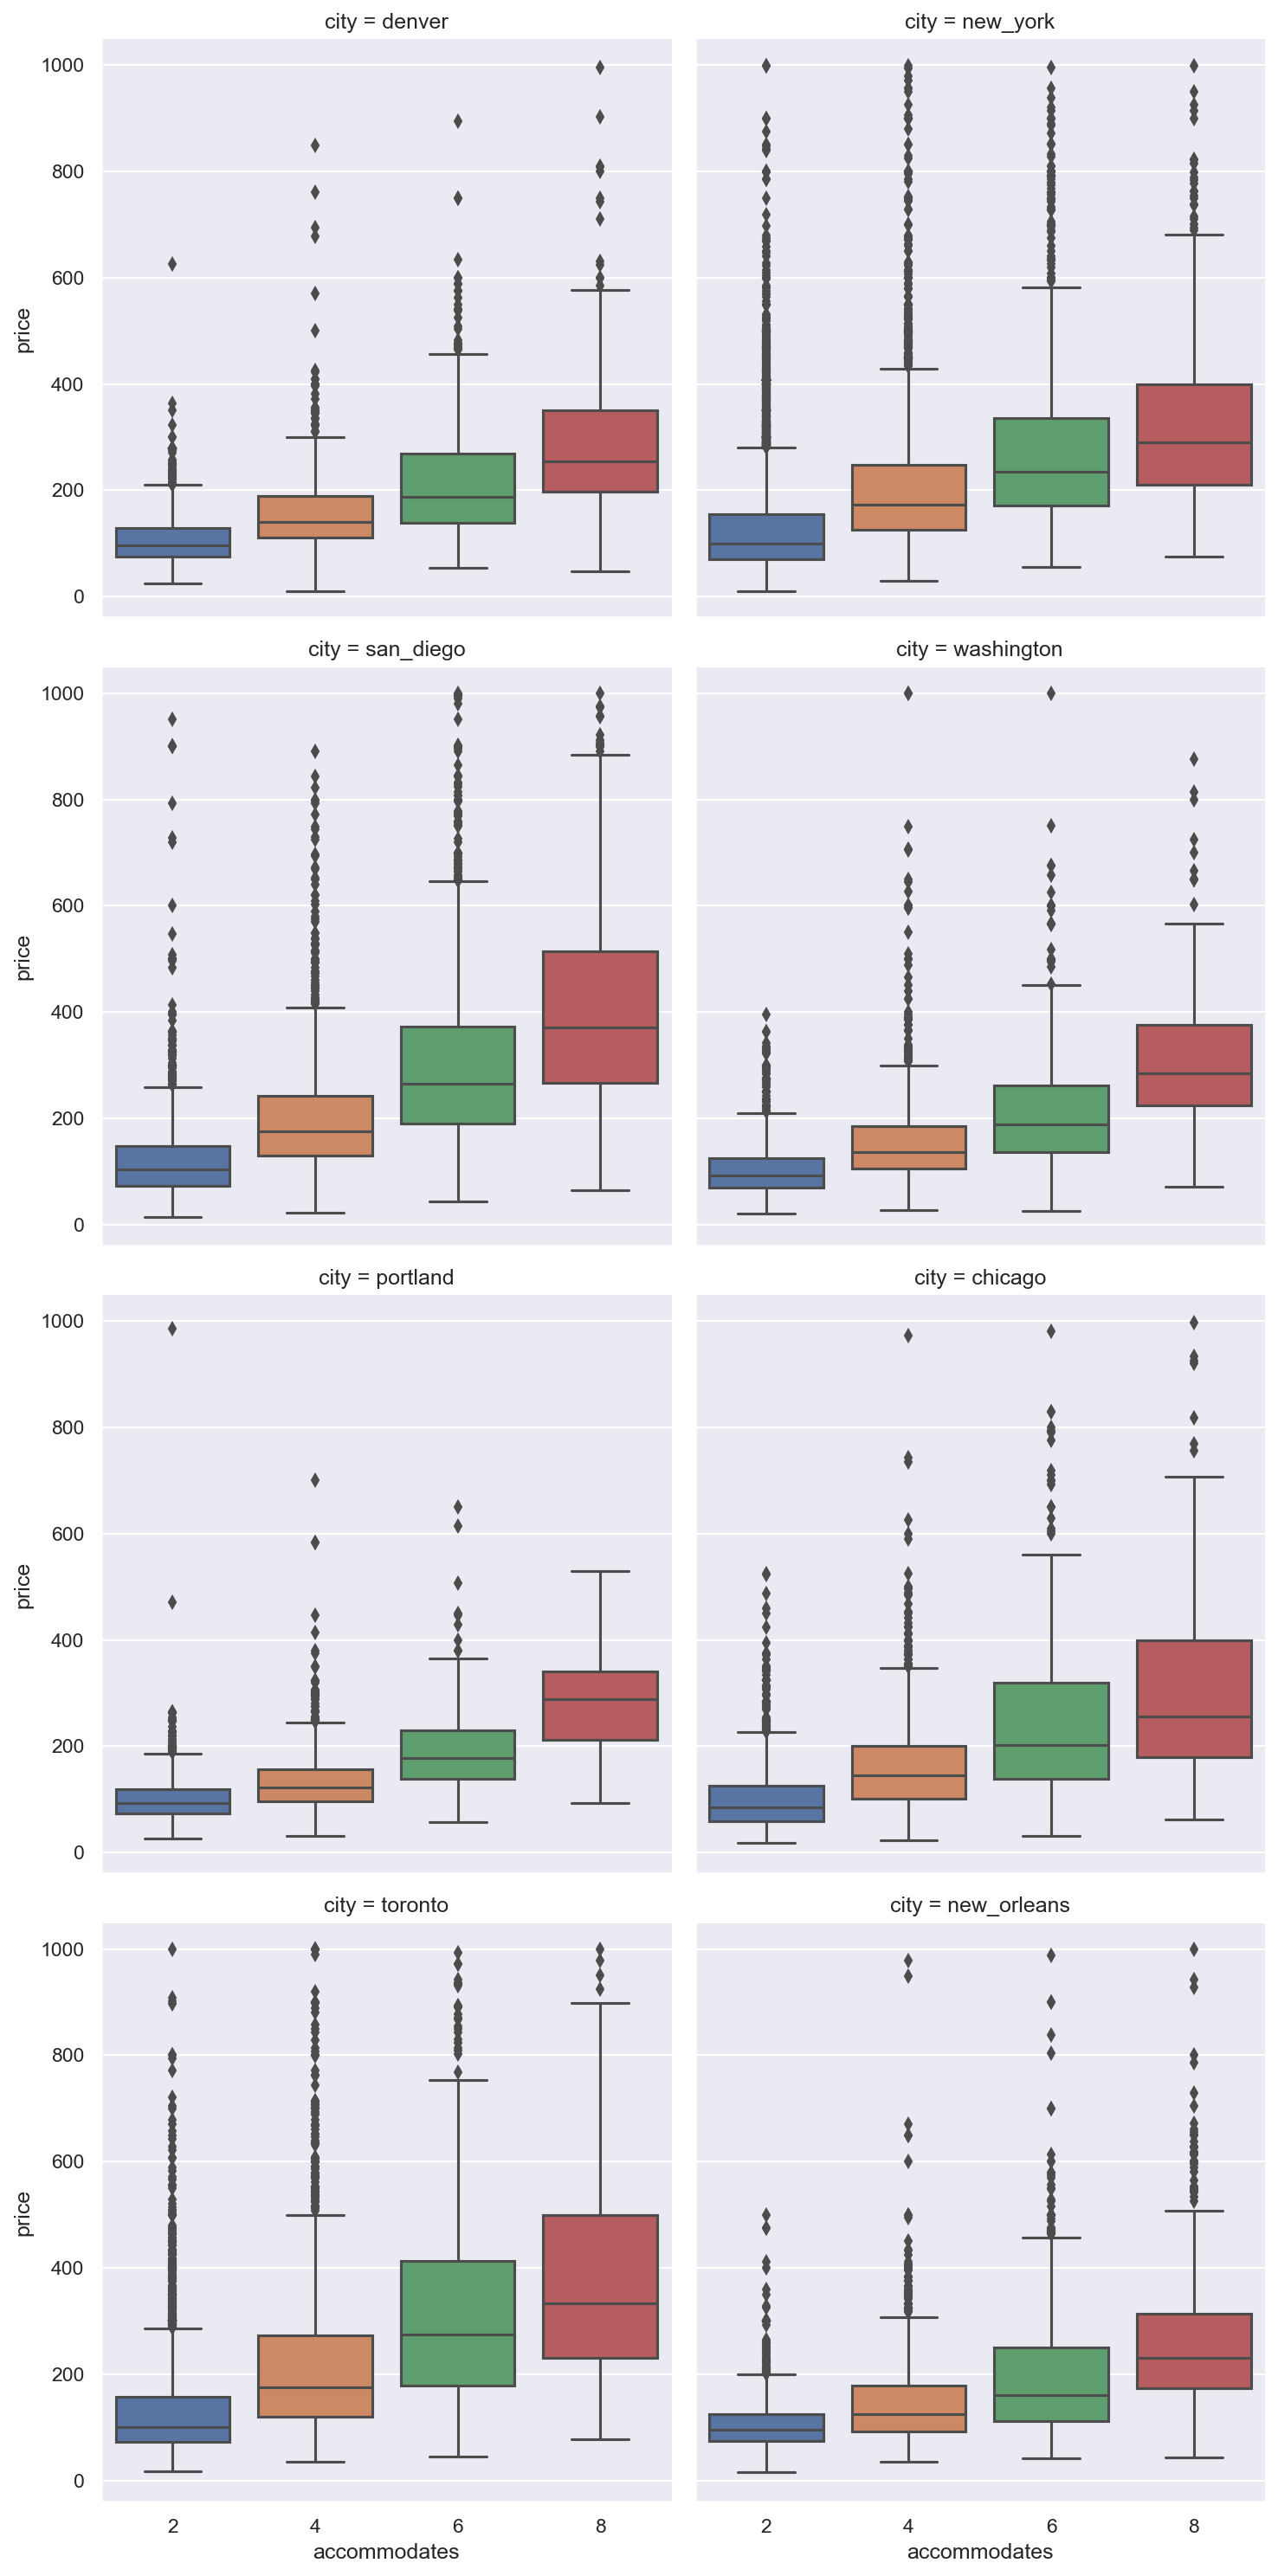
More guests accommodated results in higher prices
The biggest factor that influences the price of an Airbnb is the number of bedrooms and the number of people it can accommodate. This shouldn’t be a surprise. A quick scan of listings in your area will show places that can accommodate four people are generally priced higher than those than can accommodate two.
We can show this visually with the following plots. Each of the following box plots represents a city. In each box plot, the price distribution of listings that accommodate two, four, six and eight people are shown. We can see in each city, price increases along with the number of people a listing can accommodate.
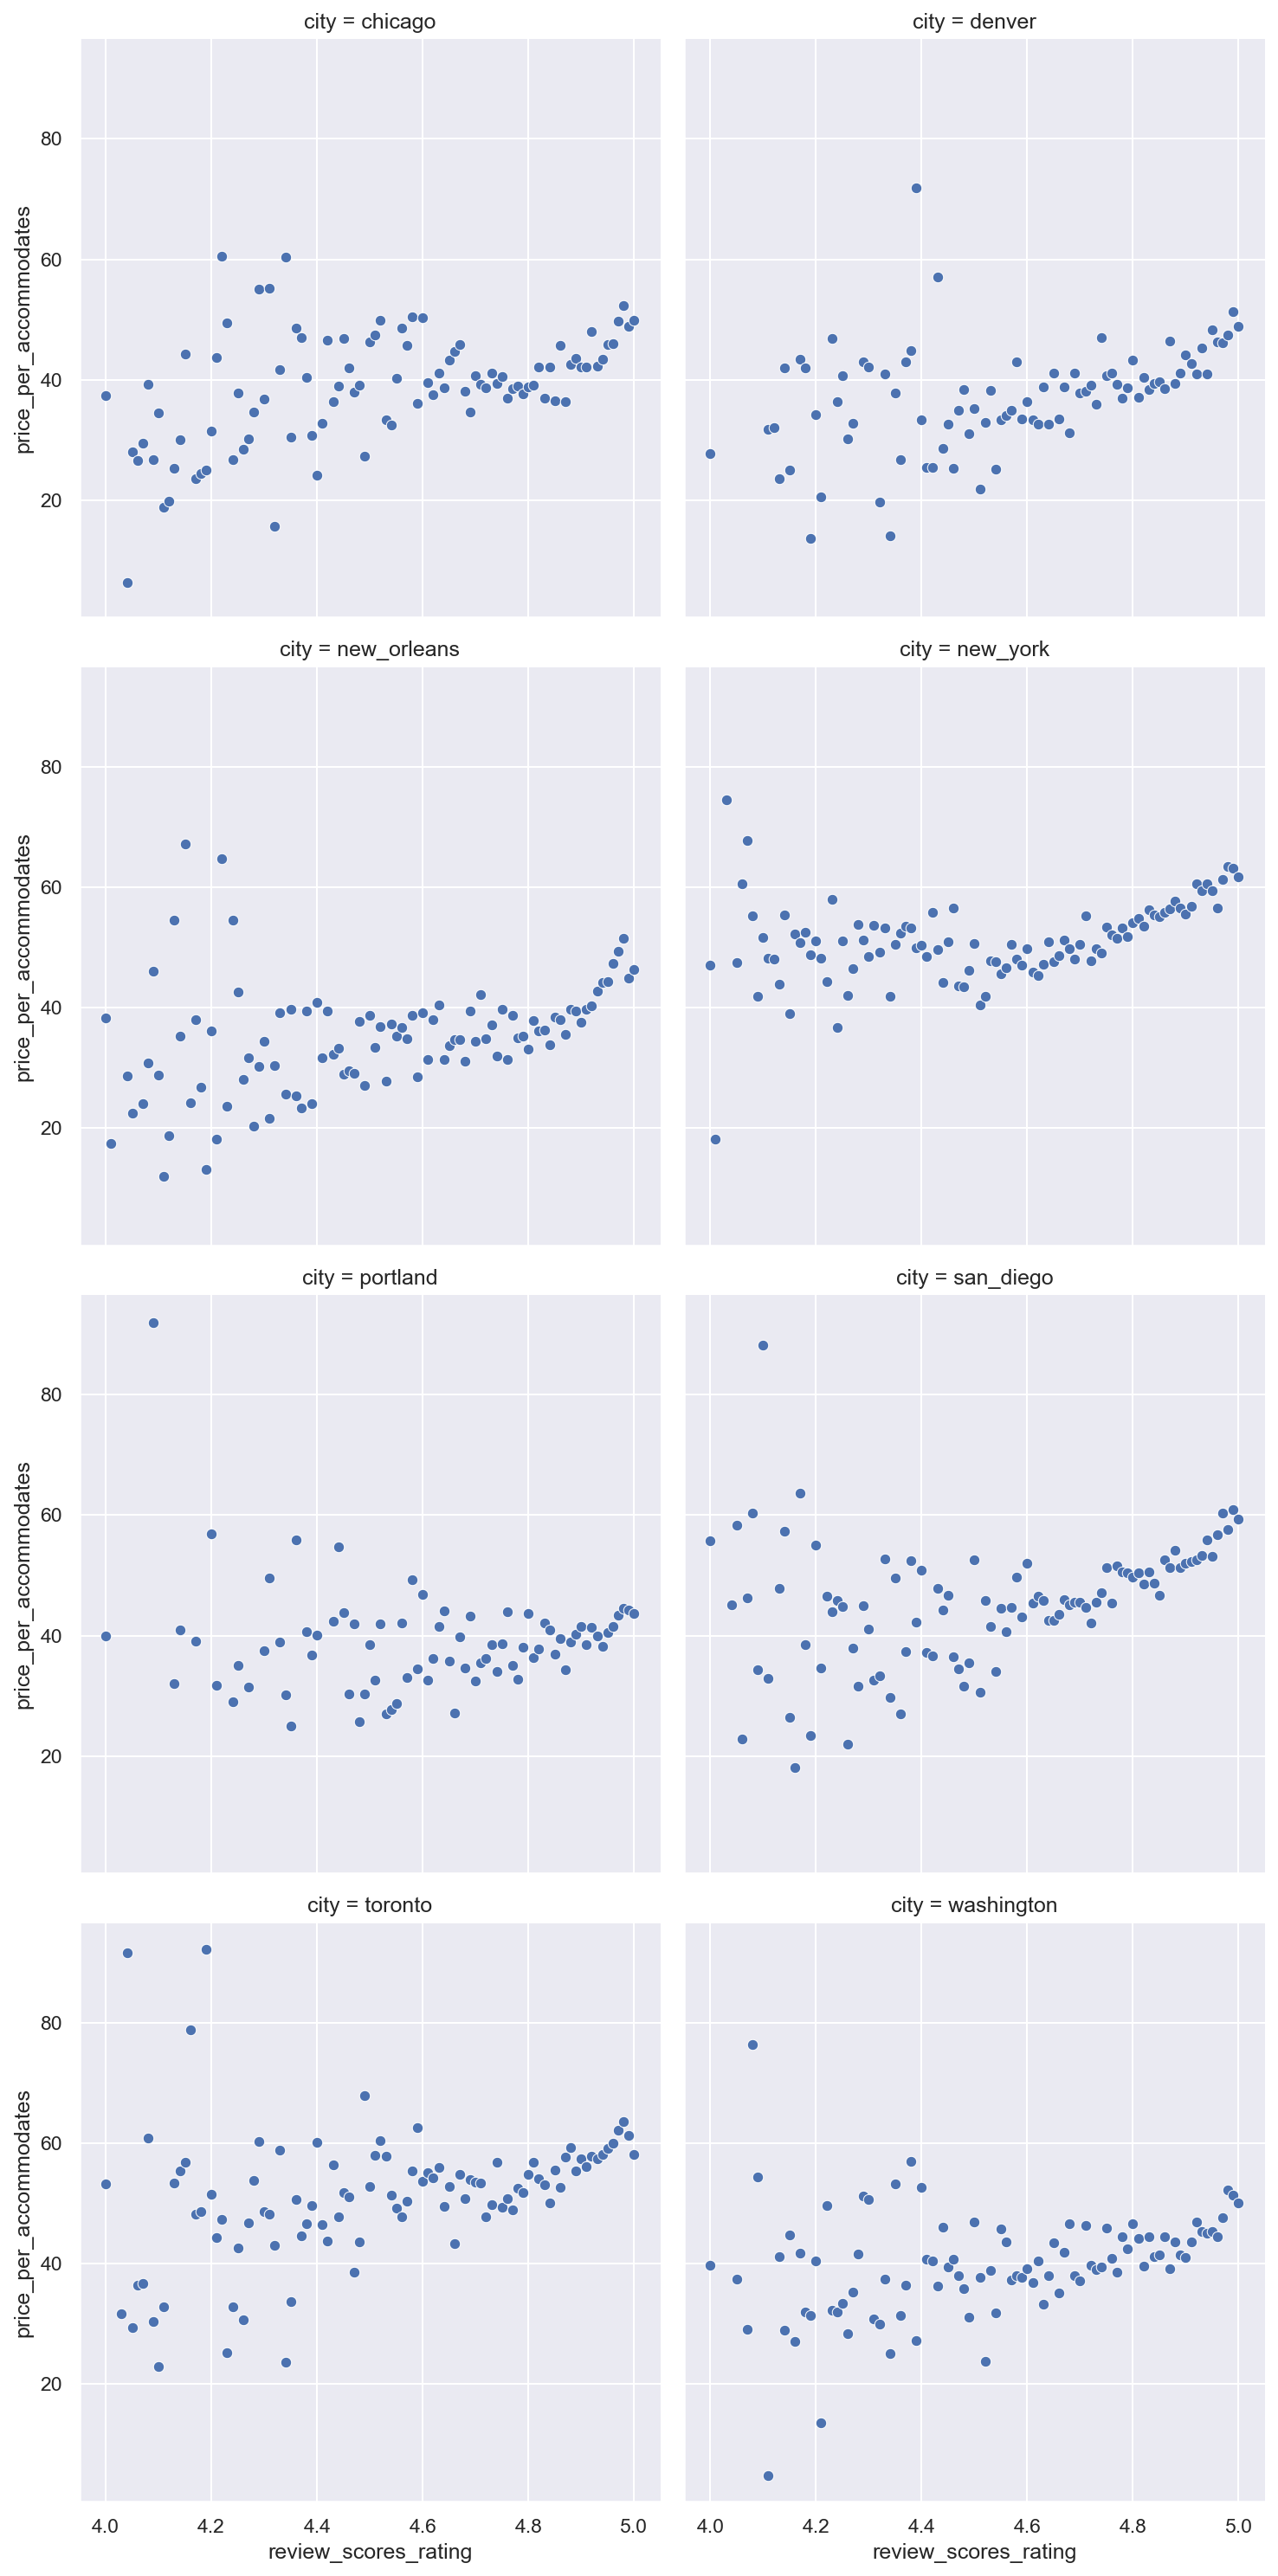
Airbnb listings with five stars are priced higher
Interestingly the overall rating has the next highest influence on price. If we assume that most guests leave reviews in good faith, then we can interpret the overall rating as a reflection of the overall quality of the listing. It stands to reason that better quality listings can charge higher prices.
In each of the scatterplots below, the average price per number of guests accommodated is plotted against the overall rating. We can see there’s a subtle upward trend that is particularly noticeable as the rating reaches five stars.
Location quality is a price driver on Airbnb
Two more features which had a strong influence on predicting price are the location rating and the Walk Score. As the value of these features rise so does price indicating good locations, particularly with amenities nearby, factor into higher prices for listings.
To illustrate, we can show two maps of each city side by side. In the map on the left the Walk Score is visualized by neighborhood. The darker the color, the more walkable the neighborhood is. On the right is a map showing price per number of guests accommodated. We can see visually there is a relationship where neighborhoods with a higher Walk Score (thus closer to amenities, entertainment, etc.) command higher prices.
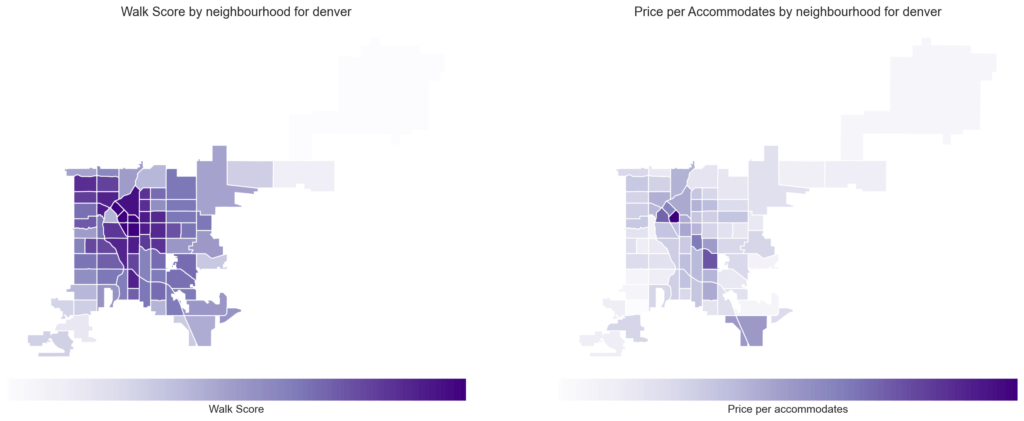
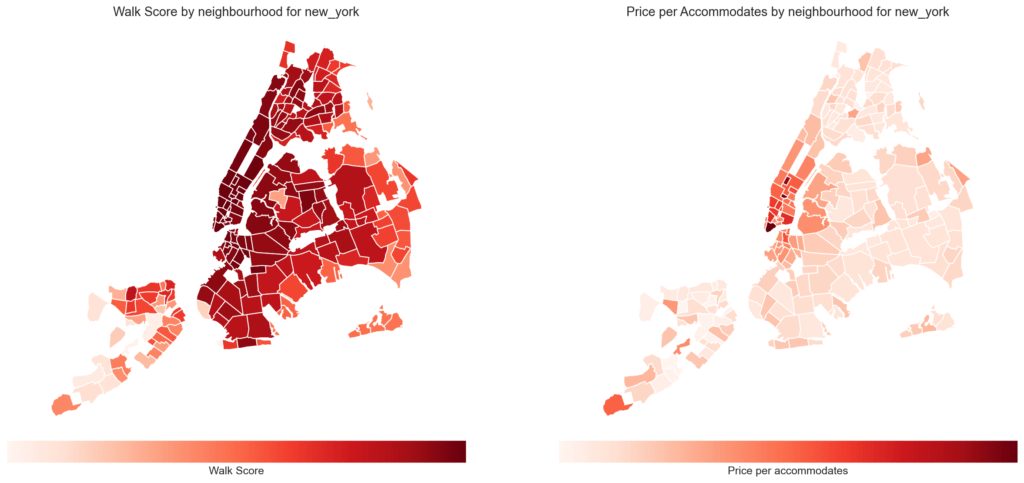
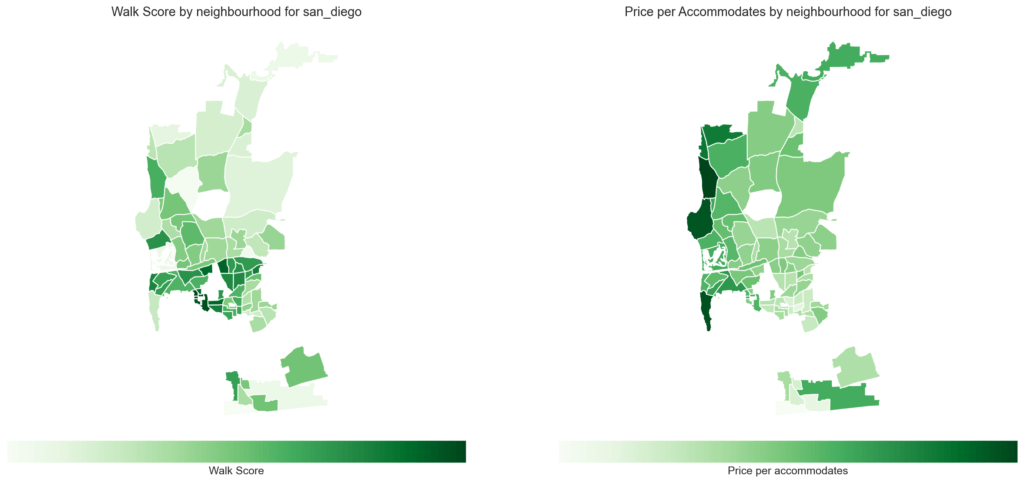
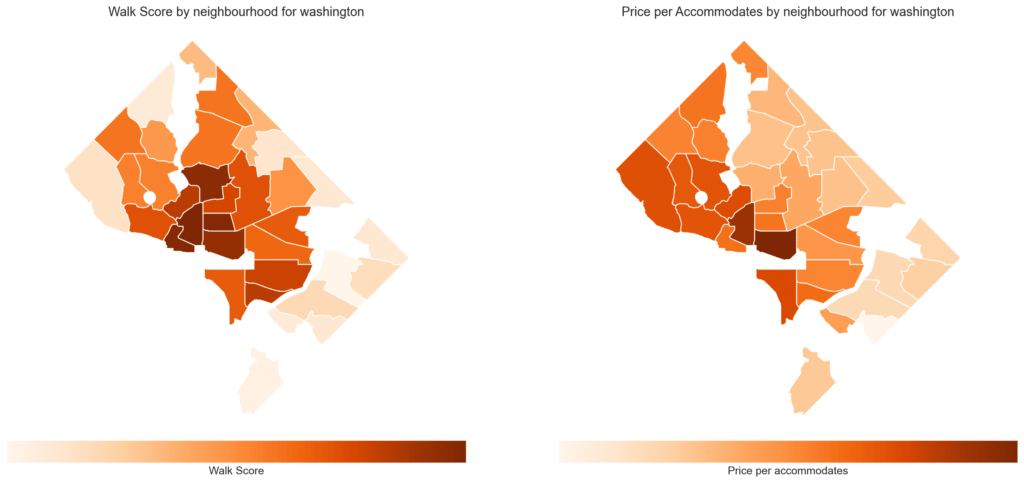
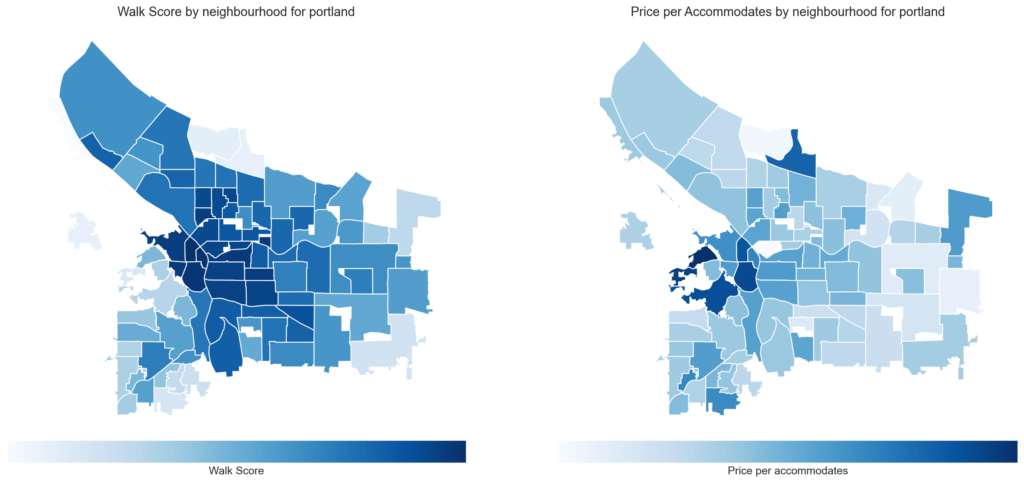
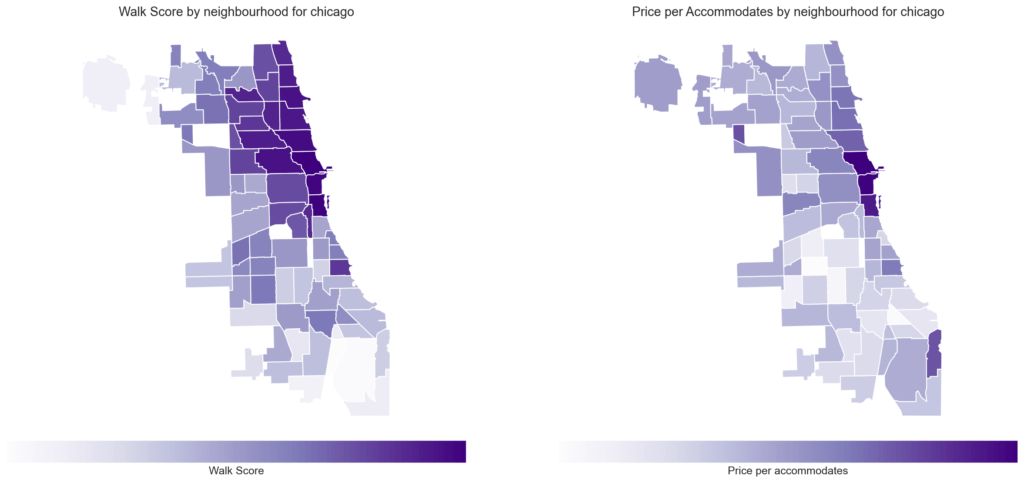
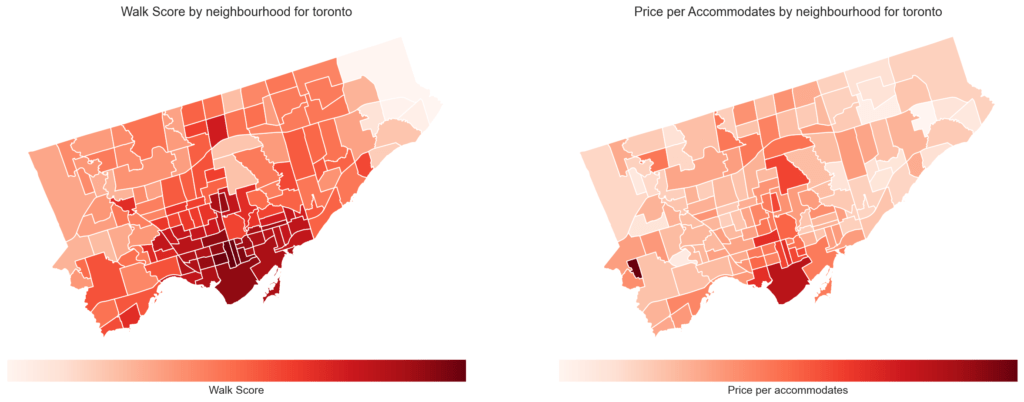
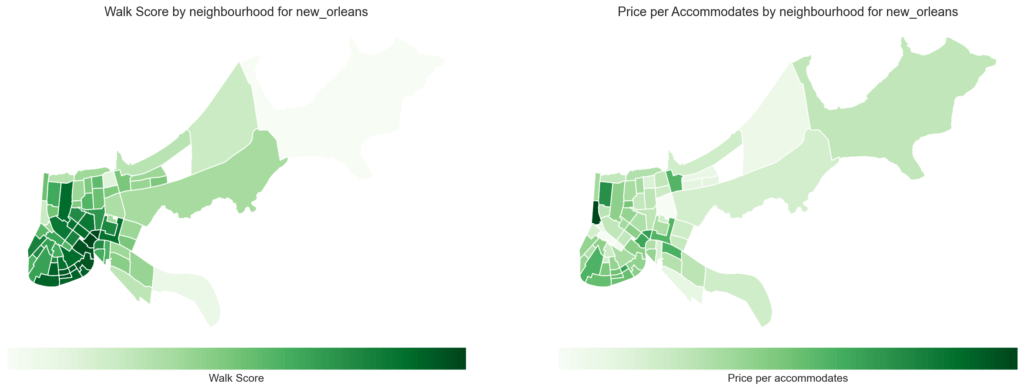
There are a few exceptions to this rule. For example, in Toronto there is an outlier that is priced higher due to proximity to the local international airport. In San Diego, neighborhoods along the coast don’t have the highest Walk Score but have prices that reflect their proximity to the water/beach.
The takeaway here is that while Walk Score can offer a reasonable approximation for the desirability of a location, there will be landmarks or features in each city that will uniquely affect demand for Airbnb listings.
Hosts charge more for entire homes
Finally, and perhaps intuitively, the entire home/apt feature has a positive influence on price as guests value privacy and are willing to pay a premium for it.
Amenities that increase price on Airbnb
Over 100 amenities were modeled but only a handful seemed to meaningful influence price. Having these desirable amenities predicted a higher price meaning hosts price these features into their nightly rate. These amenities include:
- Private patio or balcony
- Indoor fireplace
- Private hot tub
- Waterfront
- BBQ grill
A few of the amenities that appear to have a positive influence on price are associated with apartment/condo buildings such as elevator and building staff. We can infer that these amenities incidentally reflect the influence of location on price as apartments/condos are most likely to be located in dense areas with high Walk Scores.
Most amenities do not increase Airbnb price
While some amenities had an impact on predicted price, most amenities modeled did not. For example, providing board games or a coffee maker did not move the needle much on the nightly rate. This likely agrees with what most hosts would expect. Its unlikely there are many hosts who are pricing their coffee maker or board games into the nightly rate.
Rather, the benefit of including these amenities is to provide value to the guest. In a separate analysis we’ve seen the positive influence amenities have on the value rating. We also know that value is one of the category ratings that most strongly influences the overall rating. In this analysis, we’ve seen that high overall ratings predict higher prices for listings.
Therefore, amenities that can’t be priced into the nightly rate can still have an indirect positive influence on the nightly rate. Guests perceive value in the little things. Including these things leads to higher ratings. Listings with higher ratings are able to charge more.
Airbnb Superhosts do not charge higher prices
Some of the non-amenity features also didn’t have a significant impact on price in the model including instant booking and super host status. The category ratings for communication, accuracy and check-in also did not predict much influence on price.
Hosts charge less for higher minimum nights
Most features modeled had positive coefficients. In the case of amenities, this means when the amenity is present, the predicted price increases. In the case of non-amenity features, this means as the number increases so does the predicted price. For example, more bedrooms predict a higher price.
However, a small number of features had negative coefficients meaning an increase in those features predicted a lower price.
One such feature was minimum nights. As the minimum nights for a listing increase, the nightly rate declines. Here we can infer a tradeoff. Hosts are offering a lower nightly rate but only because guests are agreeing to stay for more nights. The host rationale for this could be to manage turnover costs or that hosts simply want to manage fewer guests.
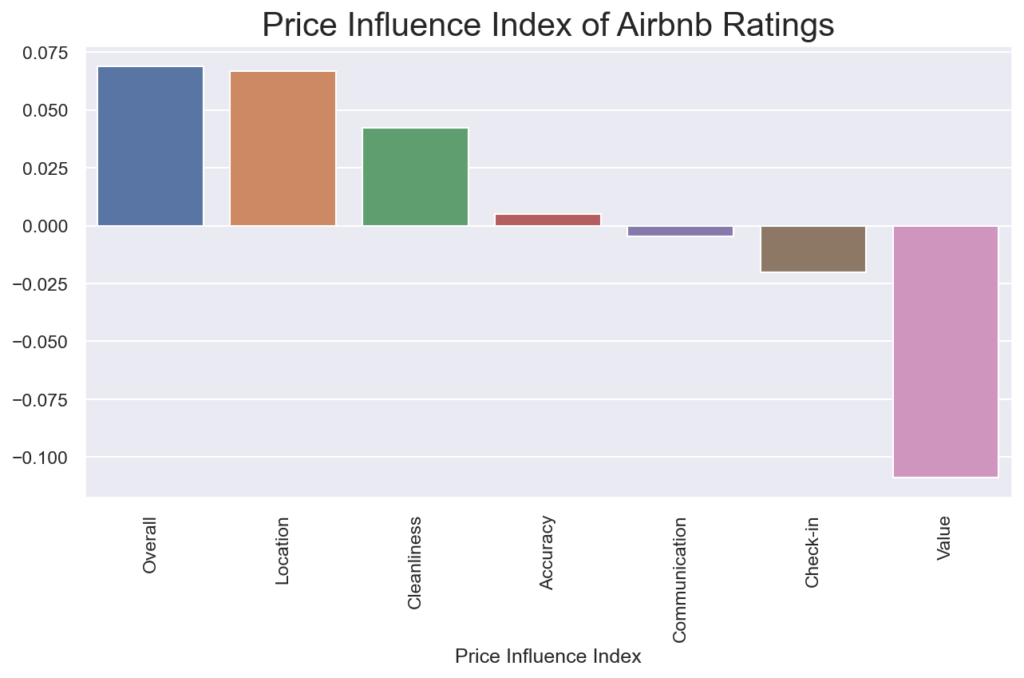
Airbnb value rating declines as price rises
Another feature in the model that results in a declining price as it rises is the value rating. As the value rating for a listing rises the predicted price drops.
To understand this, we need to consider the definition of value (value = benefits – cost). The interpretation here is that as the price of a listing increases, it can be harder for a host to deliver enough benefits to outweigh the cost, thus creating value.
That’s not to say that higher prices always lead to lower value ratings. But hosts who charge higher nightly rates than their competitors will need to justify it to maintain a high value rating.
The following chart shows the influence of the value rating on price compared to other category ratings.
Limitations of the model
While we uncovered some interesting insights in this analysis by modeling price as a function of features, this approach has its limitations.
One issue with such a model is that it doesn’t consider the motivations of hosts. In a previous analysis, we uncovered nine host segments each with unique characteristics that would impact their pricing rationale.
Another issue is the influence of Airbnb themselves. Tools such as smart pricing may suggest lower prices to maximize bookings. Increasing the number of bookings is in the best interest of Airbnb as a platform. But it may not be in the host’s best interest and is yet another conflicting motivator for price.
When we consider all these influences on price, it would be impossible to have a highly accurate prediction using only Airbnb data.
How Airbnb pricing tools works
The analysis presented here used a relatively straightforward regression technique and a limited number of variables from a static point in time. For Airbnb pricing tools trying to predict price, we can assume that the data they collect and analyze is far richer than what is widely publicly available. They most likely consider price as a function of time (which was not done here) as well as include other data sources in their models.
Even with all that added complexity, for the reasons discussed above, Airbnb listing price is a uniquely challenging data point to predict. It is therefore not surprising that some hosts find that predicted prices don’t align with what they would expect or have experienced.
In fact, all predictive models are limited by their inputs and for Airbnb price, a characteristic specific to a listing could invalidate any prediction. In an extreme example the Flintstones house available to rent on Airbnb has a unique appeal that drives demand. This appeal would make it difficult to predict price for most models.
Key Takeaways
- The features that have the strongest influence on Airbnb price are number of bedrooms, the overall quality of the listing and the location.
- Hosts can price some desirable amenities into their nightly rate, but for the most part amenities do not influence price.
- There are limitations to predicting Airbnb price using any model that does not consider the motivations of hosts.
- Even models that consider host motivation will encounter listing features that can invalidate predictions.
- Hosts should ultimately rely on their expertise along with any other input when deciding their listing price.